
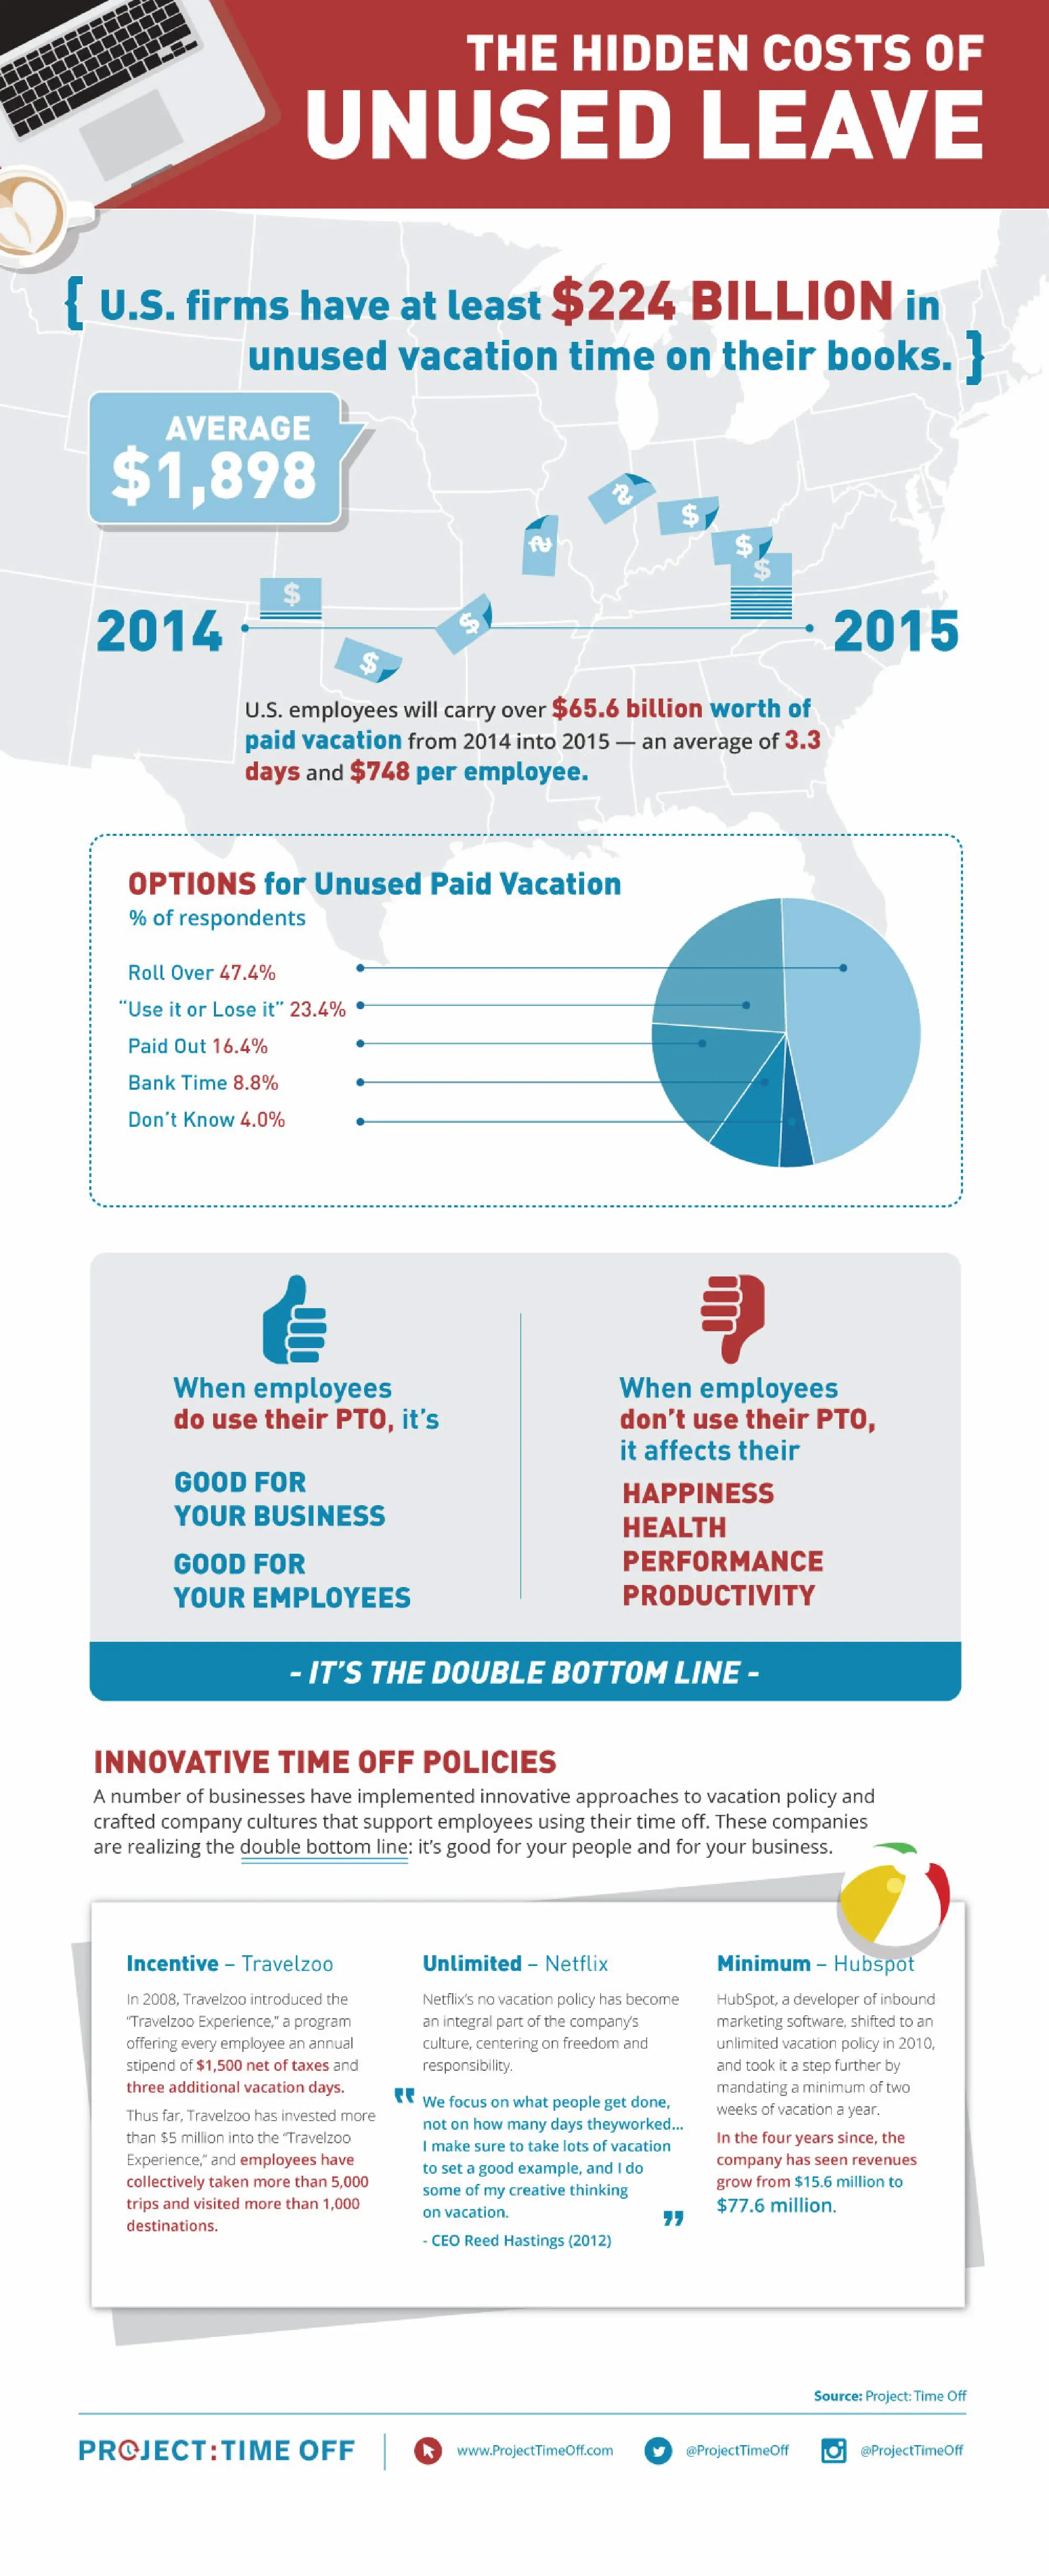
Designed a data-driven infographic on the hidden costs of unused PTO, translating national survey data, financial figures, and company case studies into a single visual narrative. The piece moves from the scale of the problem (billions in unused leave) through employee impact and into real-world policy examples from companies like Netflix and HubSpot, pairing charts, icons, and pull-quotes to keep dense statistics easy to follow.
Previous
Previous
Interstate Mining Compact Commission
Next
Next